1977 – 2 nicknames – 2 Manhattans

As a fruit, the apple thrives in diverse climates with varying conditions. While Manhattan, Kansas adopted its “The Little Apple” nickname, with a humble, playful nod to that larger, more famous “Apple” – New York City’s Manhattan – the smaller Manhattan’s adoption of its apple-inspired nickname was in many ways an ode to the resiliency of the apple, as a fruit.

Natural disasters. Economic downturns. Manhattan, Kansas. Kansas’s Manhattan certainly encountered its fair share of those. As such, the smaller Manhattan’s reference to New York’s larger “Apple“- coupled to that old lovable tale of the apple tree growing to surpass all realistic expectations in the Fall…after first encountering harrowing hardship in the Spring. The resiliency of the apple. Resiliency…just as much of an inspiration for “The Little Apple” nickname in Manhattan, Kansas as is that fun-filled nod to the larger “Apple” – New York City.

Two famous nicknames are coined…

Manhattan, Kansas first became known as “The Little Apple” in 1977. So in terms of famous nicknames, 1977 was a rather memorable year for both of the Manhattans, wasn’t it? The big one, and the little one.

Reggie Jackson becomes “Mr. October” in the bigger Apple in 1977 – as one nickname is coined – just as Manhattan, Kansas becomes “The Little Apple” in the smaller Manhattan in Kansas – as the 2nd nickname is coined. 1977. Two Manhattans. The formation of two famous nicknames. 1977.

“The Little Apple” – Back in 1855, a small group of New Englanders ventured west to found a free state. Arriving nearby what is now Junction City by way of the Kansas River, Manhattan, Kansas – “The Little Apple” – was incorporated in 1857.

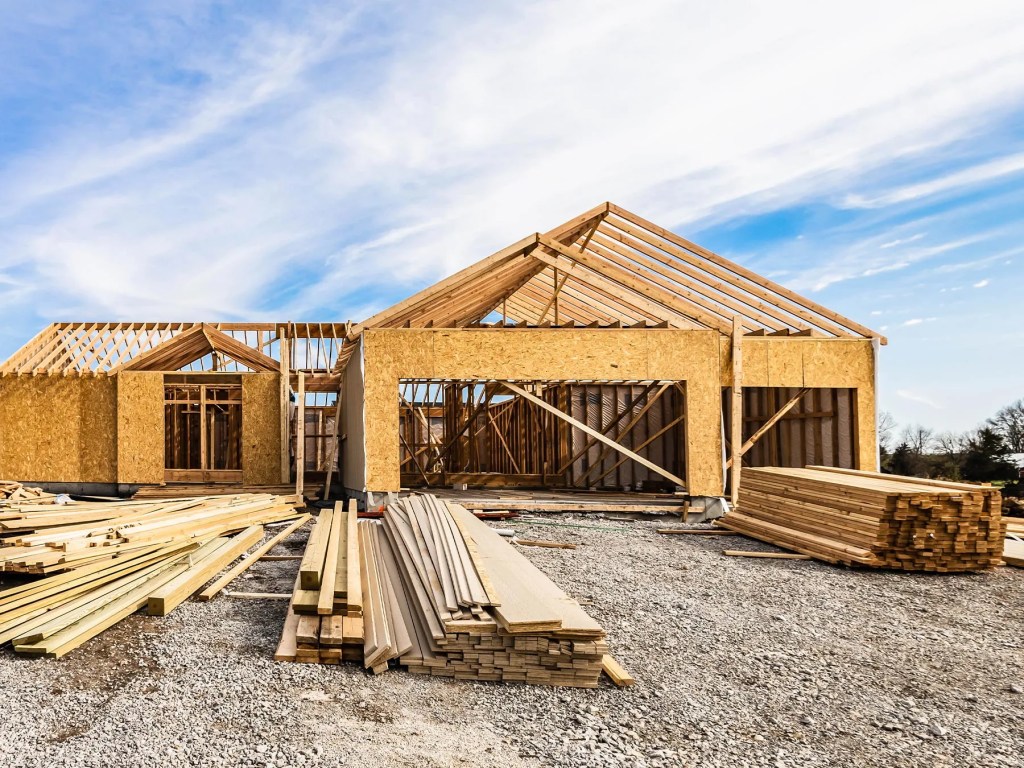
Bought your lot. Selected your builder. Rather than making call after call, there is a better way.

The purchaser of a buildable residential lot, contractors, subcontractors, investors, the lender, project stakeholders, the architect as well as your project manager… Each is individually able to remain updated as per the progress of build phases for new home construction through a Schedule of Values.

The Schedule of Values is applicable to to-be-invoiced home build performance metrics. And to phases scheduled, then subsequently completed, during each draw period for the new home build.

As each phase of the new home build has been completed – i.e.: as one draw period progresses to the next draw period – your build’s Schedule of Values is updated. An updating of your Schedule Of Values in subsequent draw periods is directly relatable to forthcoming draw requests. With each new draw request, line items in the Schedule of Values – evidencing the progression of the build, as can be measured within each draw period – are revised.

Schedule of Values


When you are rehabbing a home, let’s say plans and specs for your project will cost you $3,000. Within your Schedule of Values (“S.O.V.”), the $3,000 cost for plans and the specs will be labeled as a dollar amount within the project – “plans and specs, $3,000.” Within your S.O.V. this $3,000 cost for plans and specs will also be categorized as a percentage of your project.

Let’s say your home rehab will cost $125,000 to complete. Your plans and specs cost $3,000. So within your S.O.V., plans and specs will be categorized as 2.4% of your overall project. Itemized as a dollar amount – $3,000 – and then itemized again as a percentage – 2.4% – within your S.O.V.

When a loan officer complains about “inventory” or “their clients losing out on offers,”a humble suggestion: hand the loan officer Census data and a mirror.

According to the U.S. Census, over 12 million American households were formed between January 2012 and June 2021…whereas only 7 million new single-family homes were built.

As housing demand continues to far outpace supply, this demand could more adequately be financed…if there was an adequate supply of homes to purchase.

Arguably, home loan providers could increase their profits if and when the supply of homes catches up with the demand for homes…coupled to an available supply of mortgage money which is available to finance homes.

This being said, new home construction lending has tended to not be a primary focus for a uniquely high portion of loan officers. Construction loans which are used to finance new home builds continue to be an area of expertise for traditional banks.

So then, a think through. Should (or could) focusing on financing new home builds make sense for more loan officers, notwithstanding the fact that the majority of commission income for loan officers is derived by arranging financing for homes that already exist?

In other words, Why build a home loan origination platform as a mortgage lender to service only a small fraction of the market, comparing sales of new homes – i.e.: new home construction – to sales of existing homes – i.e.: resales?

Answers: 1) lower overall inventory levels = lower commission levels for loan officers, 2) financing what the market actually needs is usually a good business idea for salespeople, 3) less competition – the loan officer’s job will not succumb to automation.

Should a portion of the blame for our housing shortage be placed upon sales managers?

In an environment which is accompanied by elevated interest rates, hopeful home buyers are challenged by housing affordability (or a lack thereof). But the real problem is not found in interest rates. The real problem is found in inflation. Housing inflation, to be more specific.

Housing inflation, linked to the fact that, we just don’t build (or rehab) enough homes. Every year. Year after year. Same problem. So, in real estate, is it wise to simply recruit more salespeople to follow the same business model? To attain the same outcome?

What is the real sales challenge to solve? Add more homes to the market. Every year. Year after year. Meet demand.

A noted portion of homes which could be/should be added to the market each year will come through, 1) rehabbing more homes, and 2) building more new homes.

An industrywide over-reliance which is placed upon selling move-in ready homes, coupled to a lack of prioritization – and/or specialization – in creating additional housing stock is arguably a “sales management C-minus,” or a “sales management D.”

Don’t blame Jerome Powell. Our housing challenge is, in many ways, about sales management deficiencies. A lack of leadership in sales. Which, in my opinion, functions as one primary contributor to our ongoing national housing challenge. Inefficient sales management in real estate makes Jerome Powell’s tough job even tougher.

Creating more inventory is the solution. Ignoring processes which will lead to the creation of more inventory further contributes to housing inflation. To fewer sales. To less commission. And, quite possibly, to the underutilization of capable real estate professionals.

Housing Inflation – Housing Permits: New York City

Fewer new housing permits were issued in NYC in the decade of the 2010’s than had been issued in NYC in the decade of the 1960’s. Think about that for a moment.

There were 400,000 fewer NYC residents in 1960 than there were in 2010. There were 1,000,000 fewer NYC residents in 1960 than there were in 2020 – one million. This NYC housing demand – housing supply imbalance is not sustainable. Limiting (or managing) NYC housing inflation just isn’t happening.

Free market proponents tend to argue that “the market” fixes market inefficiencies. Overall, not just in NYC. Maybe. Maybe not. In relation to NYC affordable housing, has the free market functioned effectively?

The free market has not been working well in relation to housing affordability. Not in NYC. Not beyond NYC. While the market has facilitated an expansion of real estate sales professionals, I would argue that too few of those sales professionals focus on business models that could reverse housing affordability problems. Even though, developing such a business focus could provide sales professionals with a very nice real estate niche. In NYC. Nationwide. That niche? Creating (and selling) more affordable homes.

Real Estate Request For Proposals

Within a real estate request for proposals (“RFP”), a municipality would likely provide a top-down overview for prospective service providers (i.e.: Respondents). Such an overview could include pertinent information about properties included by the municipality in the RFP. These could be properties that a municipality would be looking to convey to rehabbers upon the issuance of the RFP: 1) rehabbed properties, 2) revitalized neighborhoods.

Project-specific criteria prospective service providers would hope to meet during the RFP evaluation process are outlined by a municipality within the RFP. As too would goals be. Goals the municipality is hoping to accomplish through the RFP issuance. Managed through the municipality’s service provider vetting process.

Construction Loans

With new home construction, when your home build is financed with a construction loan, a detailed itemization for work performed – coupled to building supplies – will be provided to your lender. This is done through a draw request. Having each invoice properly organized prior to submitting your draw request is an important step to take. Doing so accurately can ensure that a timely release of funds by your lender – as per the submitted draw request – takes place.

Wholesale Prices – Retail Prices

In the U.S. economy, there is a “balancing act” found within projected, planned and/or implemented wholesale-retail price increases. Just as there is a “balancing act” in managing tariffs.

Wholesale price increases, retail price increases and tariffs. Each being a conversation piece relevant to how price changes could/will affect consumer behavior. And demand.

As prices increase, consumer demand could in turn decrease. Companies opting to reduce the prices that consumers ultimately pay at the retail level, with an eye on jumpstarting demand – if demand had been deemed to have stalled out – can prove to be challenging when companies absorb higher-than-planned-for wholesale price increases. As is reflected through an increasing – or a stubbornly consistent higher-than-planned-for – Producer Price Index.

And those wholesale prices paid by corporations – prior to consumers purchasing products at the retail level? Those wholesale prices – paid by U.S. corporations – are driven up by tariffs.

“You can’t tax business. Business doesn’t pay taxes. It collects taxes.” – a quote by Ronald Reagan

What affects consumer prices?

In our economy, there is a “balancing act” found within projected, planned and/or implemented wholesale-retail cost increases. Just as there is a “balancing act” with tariffs.

Wholesale price increases, retail price increases and tariffs. Each being a conversation piece relevant to how price increases could/will affect consumer demand. Since as prices increase, consumer demand may well in turn decrease. Yet companies reducing prices at the retail level in order to increase demand – if demand had indeed diminished – can be made all the more difficult in an era of higher-than-planned-for rising wholesale prices. As would be reflected through an increasing – or in a stubbornly consistent higher-than-planned-for – Producer Price Index.